Introduction
As I write this, I am looking out of my window to beautiful, snow-covered landscapes and forests. In my opinion, winter is one of the most beautiful seasons of the year. Although it makes outdoor activities slightly more challenging, they also become more rewarding. Preparation is key here. We can face many challenges such as exposure to extreme weather, paths being hidden by snow, avalanche danger, blocked routes, and much more! However, as a diabetic, there is an additional challenge.. blood glucose management! If our blood sugar is too high, we might end up with complications in the long term. If our blood sugar is too low, we risk passing out. Almost every single action we take has an effect on blood sugar, so active management is necessary.
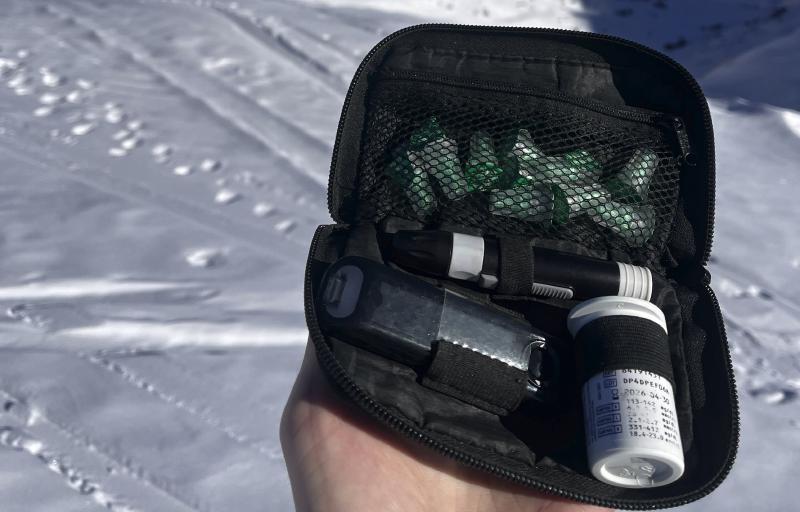
Decisions to take insulin or to eat carbs require accurate data about our current blood sugar level. In my case, this data is provided by my continuous glucose monitor (CGM) and by blood tests with my Contour Next One (as shown in the picture above). One might wonder why I rely on blood testing, when my CGM gives me a blood sugar reading every 5 minutes. Unfortunately, in practice, my Dexcom G7 often gives highly inaccurate readings or stops giving readings at all. This happens especially often in ’extreme’ environments such as at the peak of a mountain or around freezing temperatures. For that reason, I am highly dependent on my Contour Next One. These blood-based tests are supposed to be the gold standard of at-home testing.
My aim is to keep my blood sugar between approximately 3.9 and 5.7 mmol/L. If I am close to 3.9 mmol/L, I will eat some carbs. On the other hand, if I am close to 5.7 mmol/L, I might take some insulin depending on my activity level. Accurate readings are thus very important. Imagine my Contour Next One tells me that my blood sugar is 5.7 mmol/L, but in reality it is 4.2 mmol/L. In that case, I could decide to take insulin which could bring me down to a potentially dangerous hypoglycemic event! In general, my experience with the Contour Next One has been very good. However, I noticed that at colder temperatures it often reported values that were too low.
I decided to investigate whether these lower readings were just a coincidence or inherent to the device. I was shocked to find that temperature has a huge impact on readings. I will try to explain in the next section why this is actually not surprising when we consider how the Contour Next One actually works. Then, I will share some data that I collected on this topic. Finally, we will use the data to come up with a rule of thumb to correct for errors induced by extreme temperatures. Any information given in this article has been tested only on my Contour Next One and my body. Results might vary wildly for a different body, a different Contour Next One, and especially for a different type or brand of blood glucose meter.
A theoretical framework
This section will be quite technical and can be skipped if you are merely interested in the practical side of this article. I am not a biologist or chemist, but I will share my understanding of how the Contour Next One works based on my research. I am happy to receive any corrections in the comments. The basis for my understanding is a document released by the FDA on the approval of the Contour Next One1. They give the following description.
The active ingredients on the Contour® NEXT Test Strips are the enzyme, FAD dependent glucose dehydrogenase (FAD-GDH), and an electron mediator. When a blood sample fills the reaction zone of the test strip, a chemical reaction occurs in which the FAD-GDH enzyme causes electrons to pass from glucose molecules to co-factor and the mediator in the test strip. New software in the Contour® NEXT One meter converts the electrical current measurement into glucose concentration and displays the result on the meter LCD screen.
That is a lot of jargon in one paragraph! Since I am not a biologist or chemist, I had to figure out what this exactly means for myself. In simpler terms, this is how I think it works:
- The user puts his blood sample onto the test strip.
- Glucose in the sample reacts with Flavin Adenine Dinucleotide into Gluconolactone and the reduced form of Flavin Adenine Dinucleotide. $$ \text{C}_6\text{H}_{12}\text{O}_6 + \text{FAD} \longrightarrow \text{C}_6\text{H}_{10}\text{O}_6 + \text{FADH}_2 $$ In order for this reaction to happen at any reasonable speed, the presence of the enzyme glucose dehydrogenase (GDH) is required. The amount of reactions taking place (in the 5 seconds that the Contour Next One allows) thus depends on the amount of glucose in the blood as well as the activity level of GDH.
- Next, $\text{FADH}_2$ donates electrons to the electron mediator. An electron mediator is, in very simple terms, a material that facilitates electron transport through chemical reactions. For simplicity, you could see it as a fancy electric conductor. It is used, because it has the ability to take the electrons from $\text{FADH}_2$ and deliver them to an electrode.
- After the electrode receives the electrons, it will register those as a small current. The amount of current reaching the electrode is directly related to how many reactions take place in step 2. Assuming the activity level of GDH is fixed, we can then estimate the blood glucose levels in the blood sample based on this current.
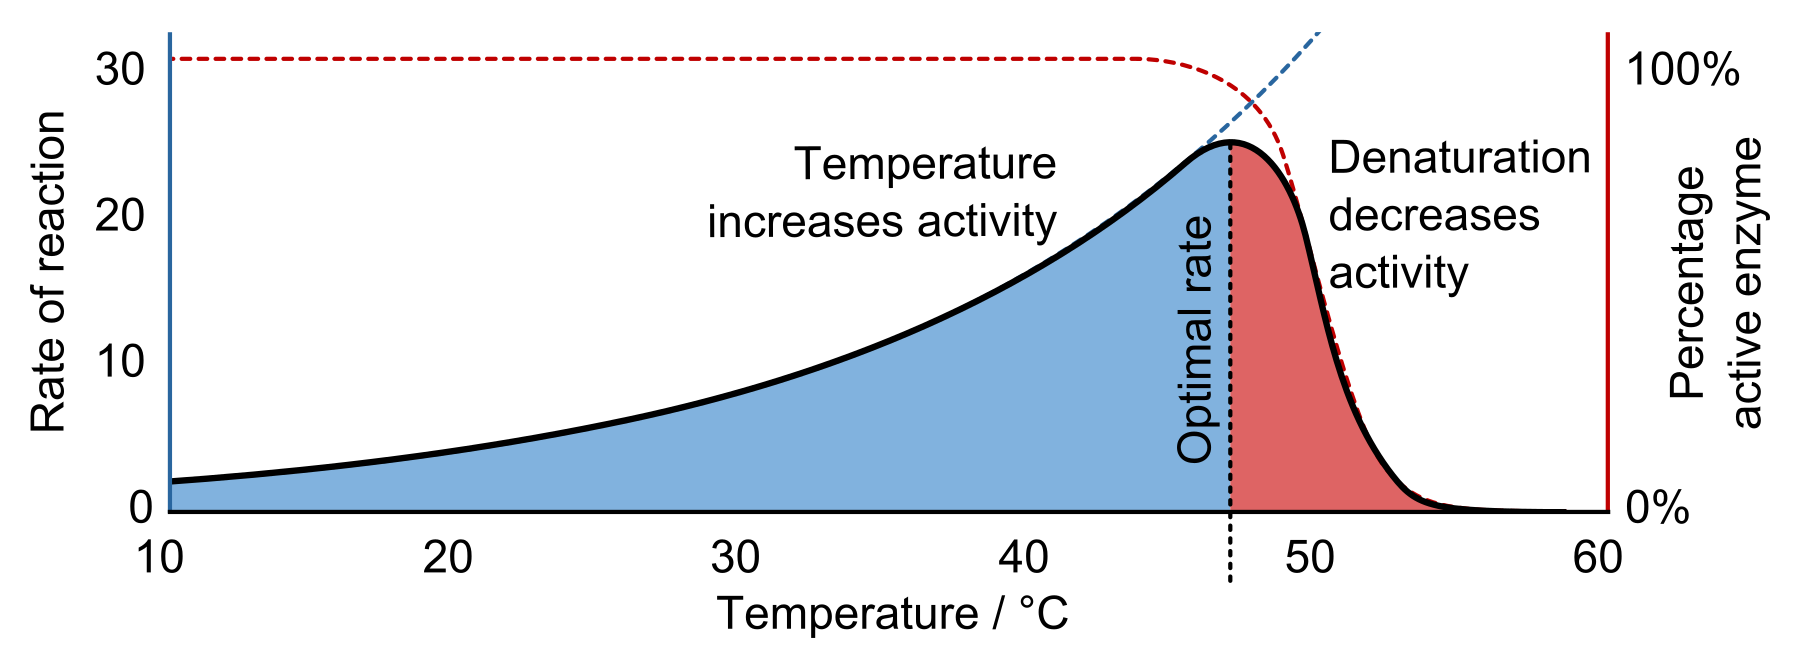
Now that we have an idea of how the Contour Next One works, the natural next question would be which of the above steps is influenced by temperature? The answer is simple… all of them are! However, I believe that the majority of the temperature dependence comes from step 2. In fact, it is well-known that enzyme activity is highly temperature dependent. I took the following picture from Wikipedia2.
![]()
![]()
As you can see, the ‘rate of reaction’ is strongly dependent on temperature. Activity of individual enzymes goes up with temperature. However, for high enough temperatures, enzymes start to break down (denaturation) and thus total activity goes down. This means that there is an optimal temperature for these reactions. The above figure is illustrative, but the optimal temperature and the exact shape of the figure will differ for different enzymes.
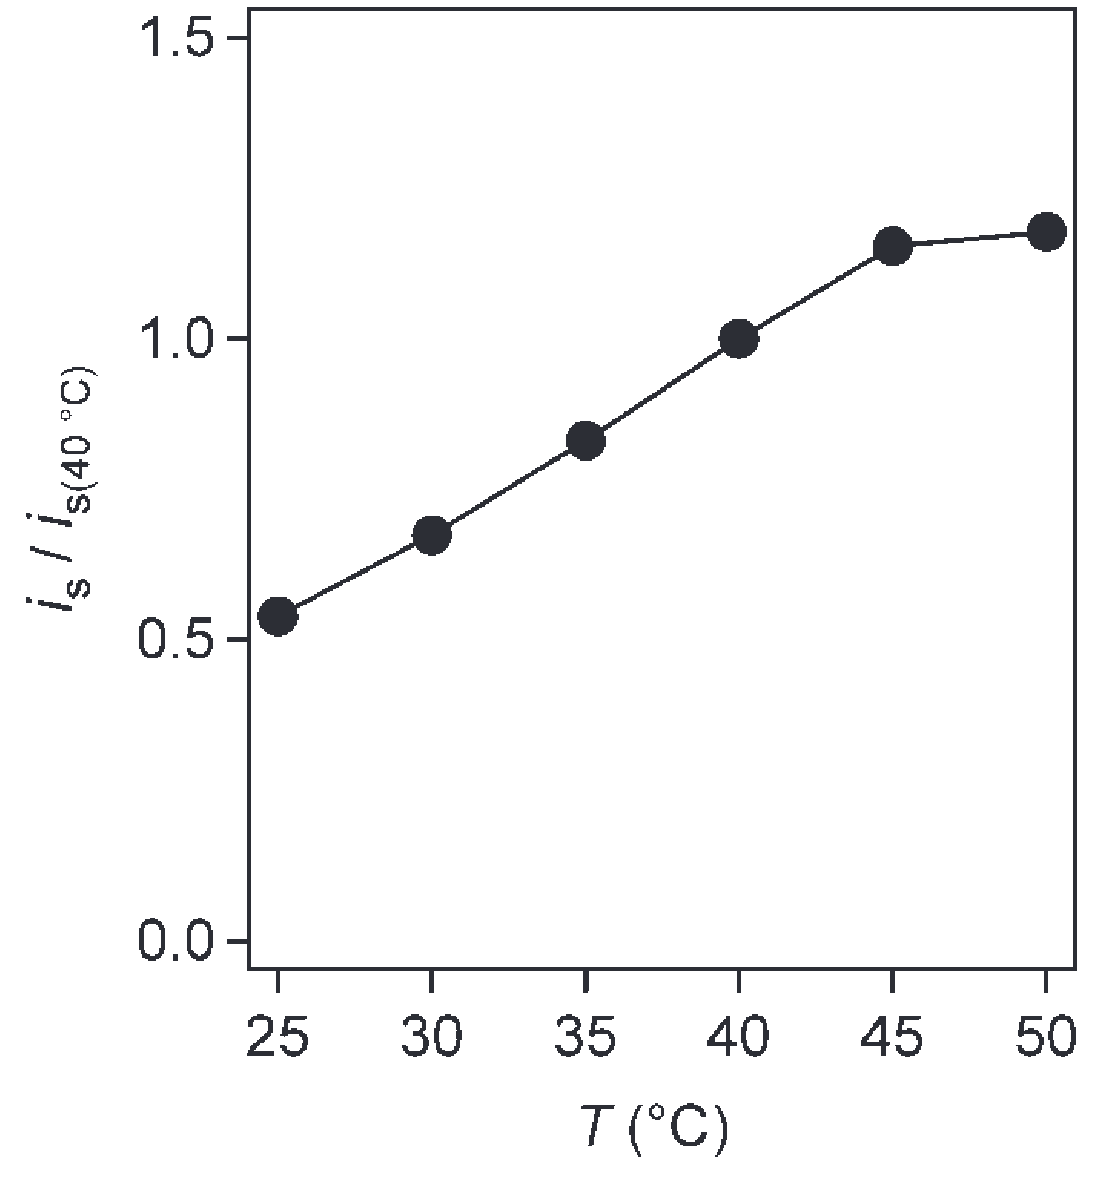
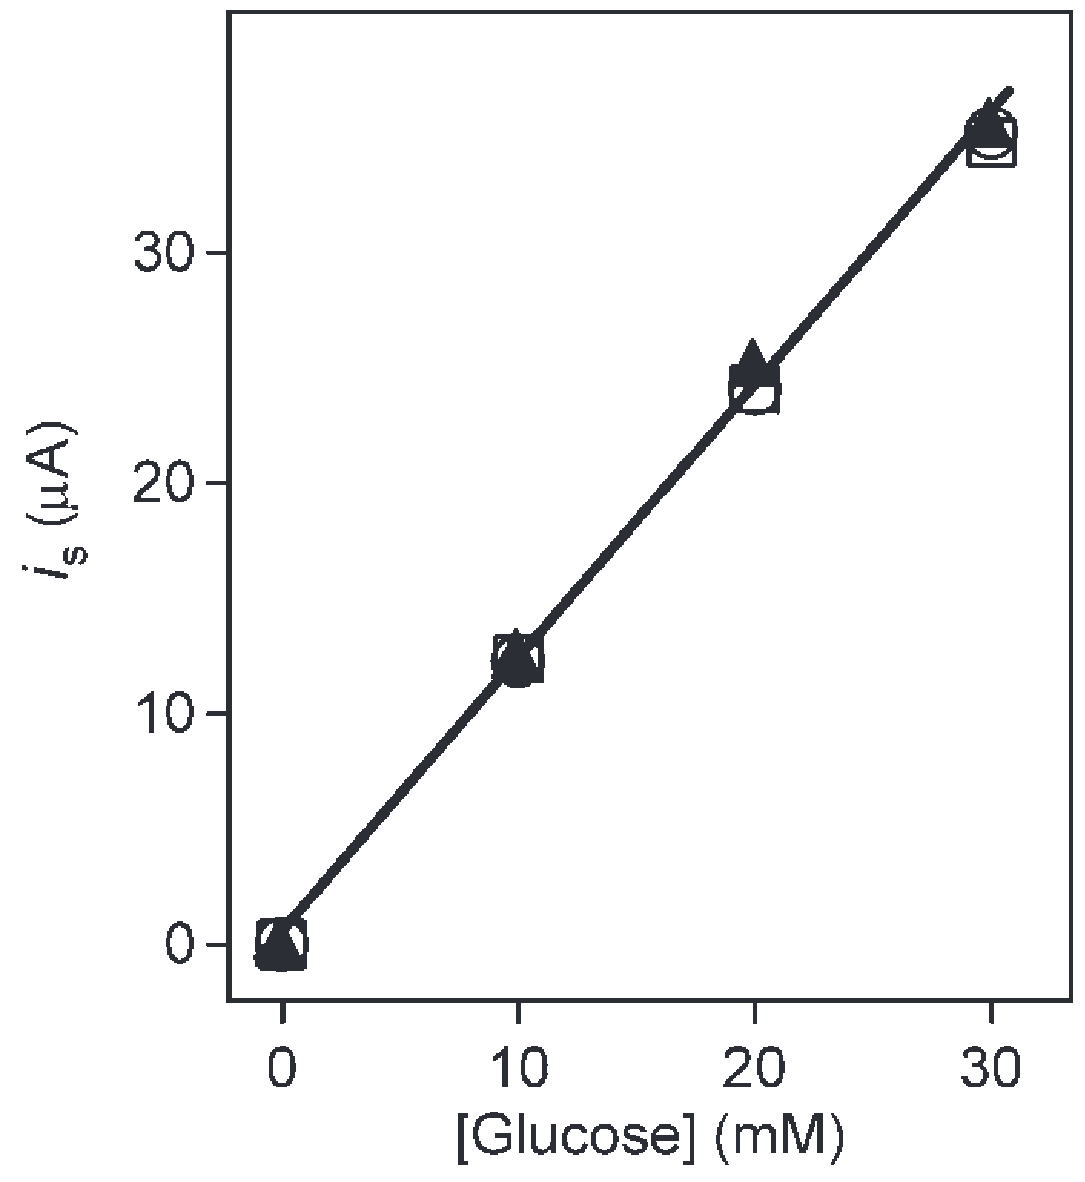
In practice, we are interested in the current that arrives at the electrode and how this current depends on the glucose and temperature levels. The temperature-dependence of the current is equivalent to the temperature-dependence of the first three steps combined! In literature3, we can find experiments done on a specific version of FAD-dependent glucose dehydrogenase and a specific electron mediator. These might not agree exactly with the ones used in the Contour Next One, but they will give us an idea. We have the following figures.
![]()
![]()
The right figure shows us a very clear linear relation between the measured current and blood glucose. Thee three lines correspond to air-, oxygen-, or argon-saturated environments. The almost perfect overlap of these lies implies that the current and thus the readings are independent of oxygen levels. This is good to know when doing a blood test at altitude. The left figure show us that there is a linear relation between the measured current and temperature as long as the temperature does not exceed approximately 45°C. Since the Contour Next One does not have a temperature sensor built in, it must assume a temperature-independent relationship between blood glucose and current. They must have decided to calibrate the Contour Next One at a fixed temperature. It is unclear which temperature this is, but I will assume it to be close to room temperature at 22.5°C. According to the theory, we would then expect the following relation between the blood sugar reported by the Contour Next One ($BG_{\text{Contour}}$), the actual blood sugar ($BG_{\text{actual}}$), and the temperature ($T$)
$$BG_{\text{Contour}} = BG_{\text{actual}} + \beta (T-22.5^\circ C)+\epsilon_1,$$where $\beta$ is some constant and $\epsilon$ is an i.i.d, normally-distributed, random variable with mean zero and variance $\sigma^2$ that accounts for noise in the measurement. Both $\beta$ and $\sigma^2$ can be approximated through data. We will do this in the next section.
The data
The theory from the previous section is interesting, but it does not give us any actionable information. In order to understand our specific set-up (the Contour Next One), we have to collect data. Since I do not have access to a reference device such as a lab-grade blood glucose meter, I had to come up with a different way of collecting data. In order to collect accurate data, we need to be able to do two measurements at different temperatures within a timeframe such that the true blood sugar does not change much. I live in an apartment and have access to a balcony. The idea is that the temperature on the balcony ($T_{\text{out}}$) is different from the temperature in my livingroom ($T_{\text{in}}$). I placed a thermometer in the living room and on the balcony. Then, I came up with the following sample collection procedure:
- Make sure my blood sugar is stable. This means that I should have no active insulin on board and no food in my digestive system.
- Wash my hands to make sure dirt does not affect the readings.
- Check the temperature in the living room ($T_{\text{in}}$) and note it down.
- Do a blood test in the living room and record the measured value ($BG_{\text{in}}$).
- Go out onto the balcony and sit down for two minutes.
- Check the temperature on the balcony ($T_{\text{out}}$) and note it down.
- Do a blood test on the balcony and record the measured value ($BG_{\text{out}}$).
Generally, the temperature in the living room is determined by the central heating system in the building and is quite high (around 23°C). The temperature outside changes every hour. I cannot influence either of these temperatures. To get a representative set of data that covers a wide range of temperatures, I had to do measurements for a couple months in a row.
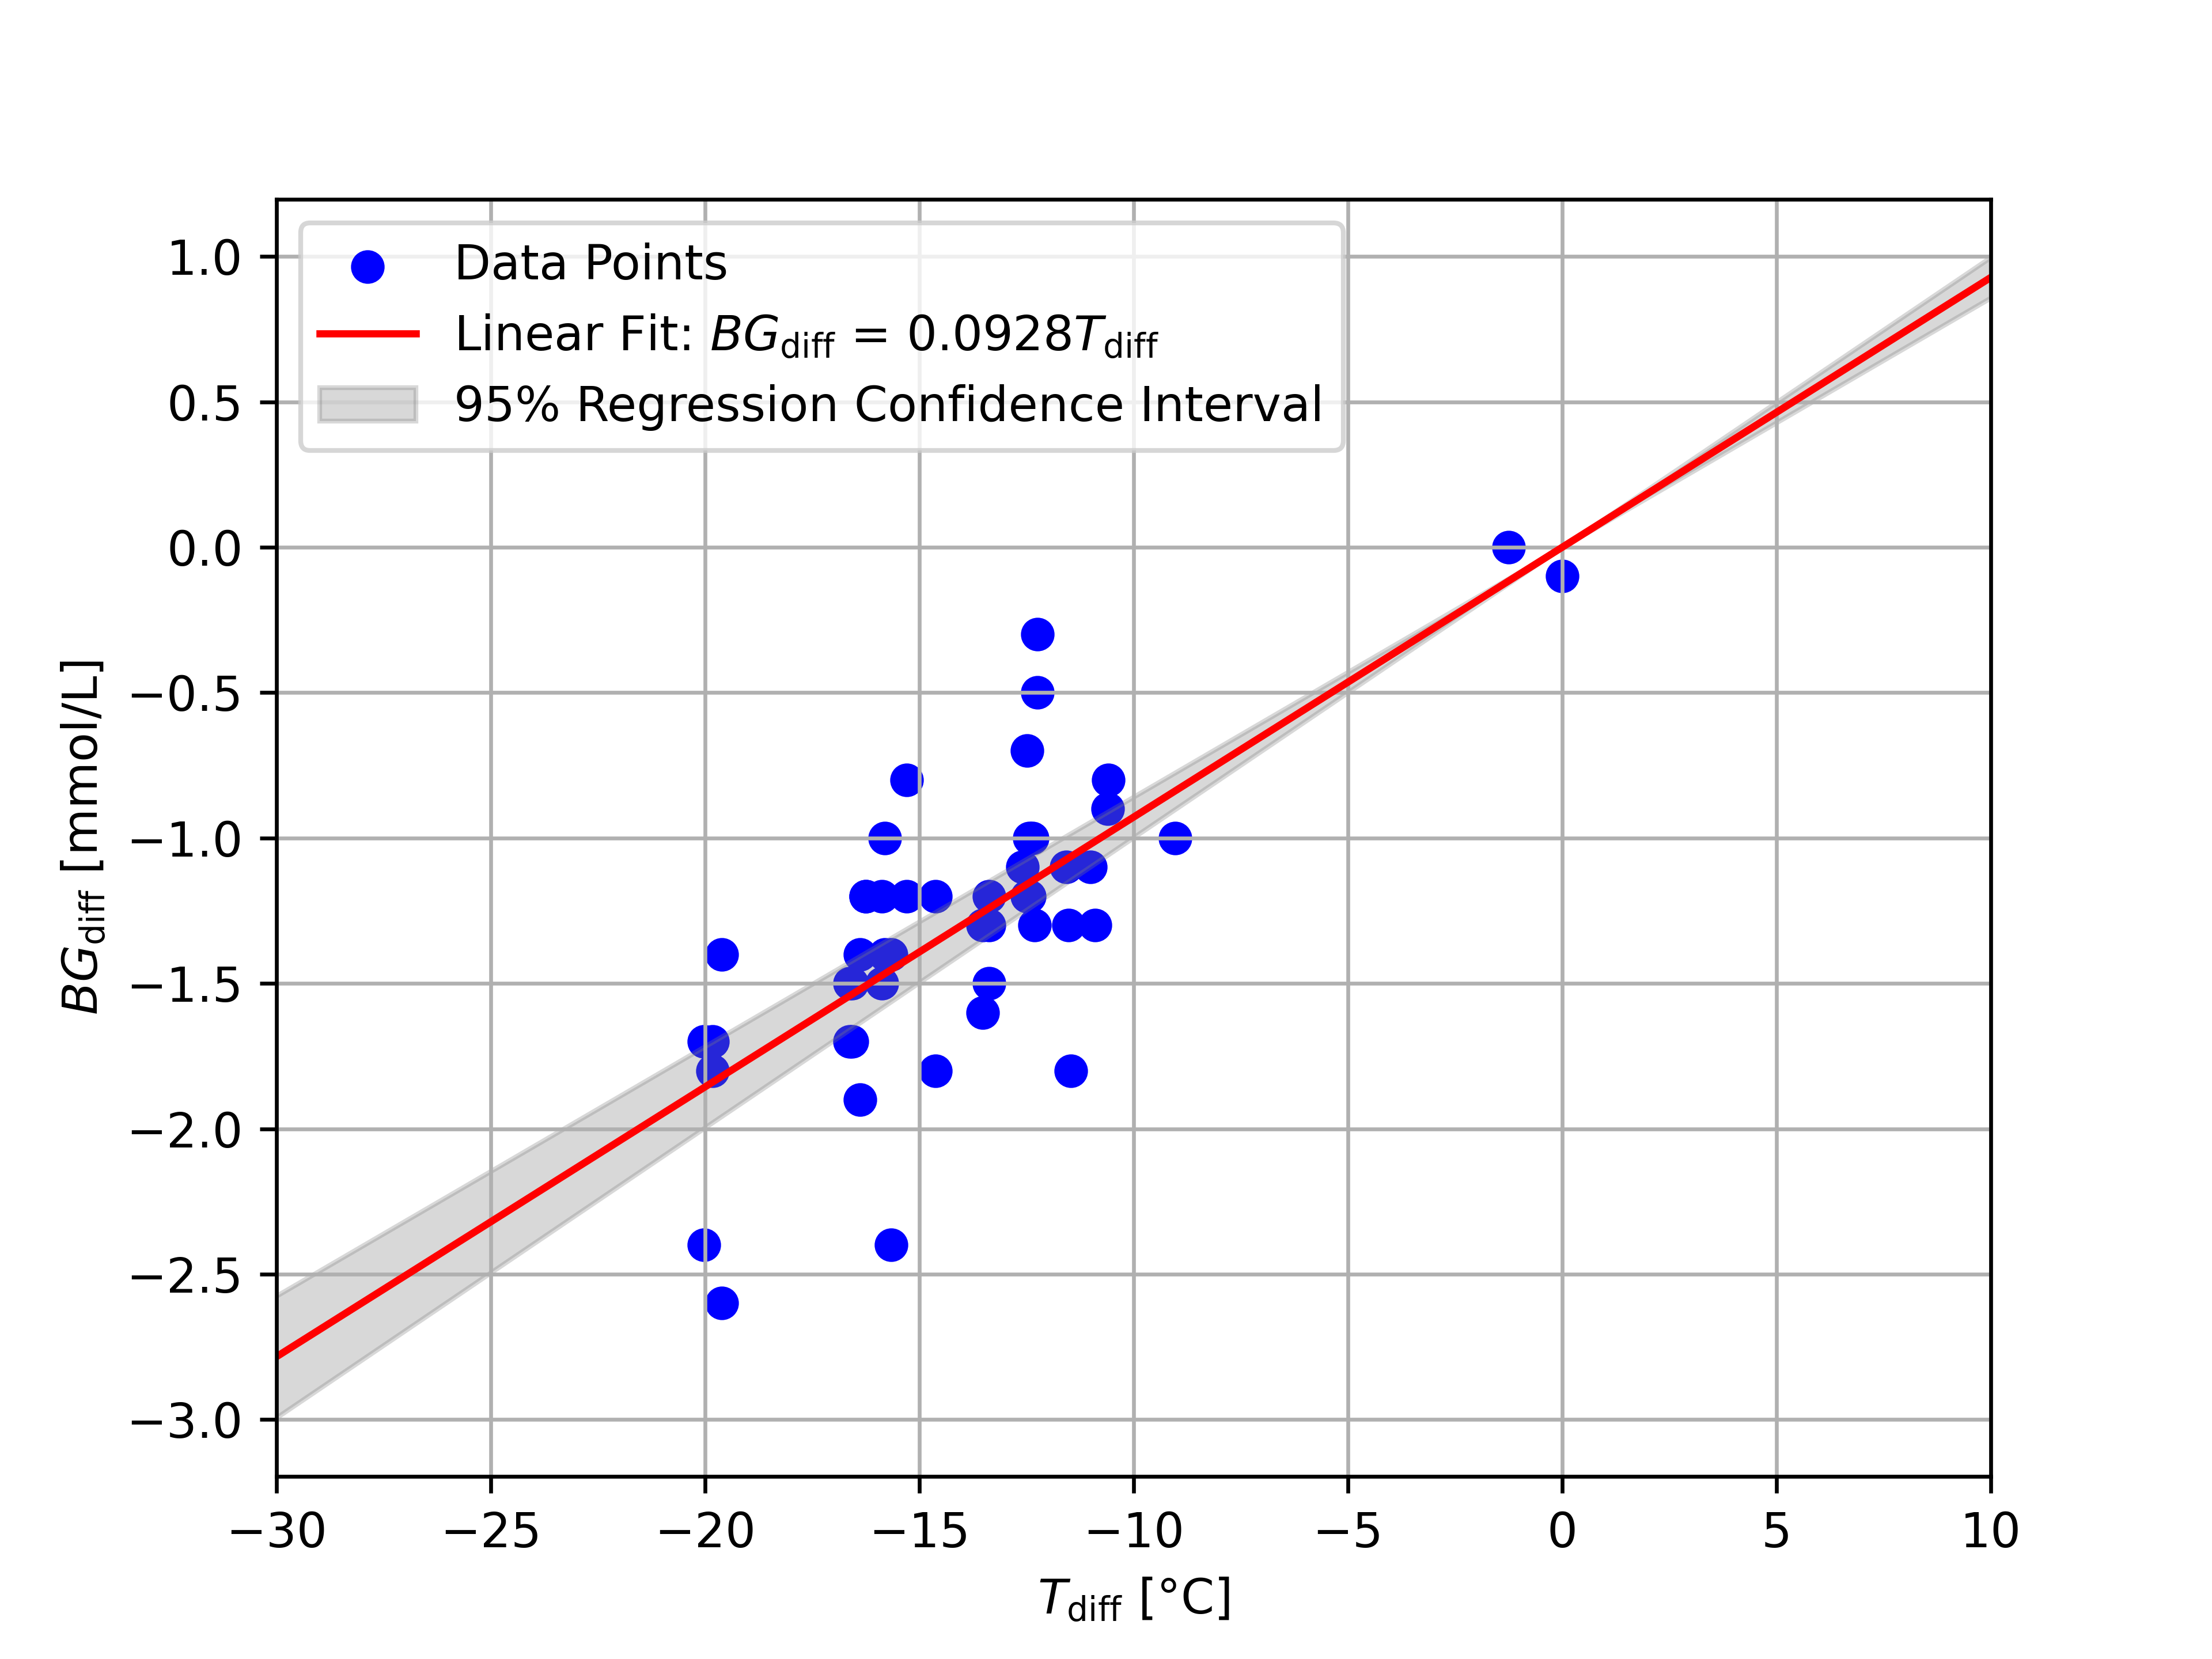
In order to make any sense of the data, we need to make some assumptions. From the previous section, we know that assuming a linear relation between temperature and reported glucose value is reasonable. This allows us to only look at the relation between the difference in reported blood glucose, $BG_{\text{diff}}=BG_{\text{out}}-BG_{\text{in}}$, as a function of the difference in temperature, $T_{\text{diff}}=T_{\text{out}}-T_{\text{in}}$. We obtain
$$BG_{\text{diff}} = BG_{\text{actual}} + \beta T_{\text{diff}}+\epsilon_2,$$where $\beta$ is the same as in the previous section and $\epsilon_2$ is again a normally-distributed, i.i.d., random variable with mean zero, but now has a variance of $2\sigma^2$. We can then apply a no-intercept linear regression to the data to obtain an approximation of $\beta$ and the associated 95% regression confidence interval4. Our approximation for $\beta$ is 0.0928 with a 95% confidence interval of $[0.0858, 0.0100]$, while the variance is approximately $\sigma^2=0.0305$. This means that we are 95% sure that the graph $BG_{\text{diff}} = BG_{\text{actual}} + \beta T_{\text{diff}}$ lies within the grey area of the following figure.
![]()
![]()
Some might argue that this confidence interval is incorrect, because many of the data points lie outside the grey area. The grey area, however, shows the 95% regression confidence interval, not the 95% prediction interval! Every data point can have a lot of noise (large $\sigma^2$), but, with sufficiently many points, we can still obtain a very accurate approximation of $\beta$. This figure and the confidence interval show that we have sufficient data to make a decent approximation for $\beta$.
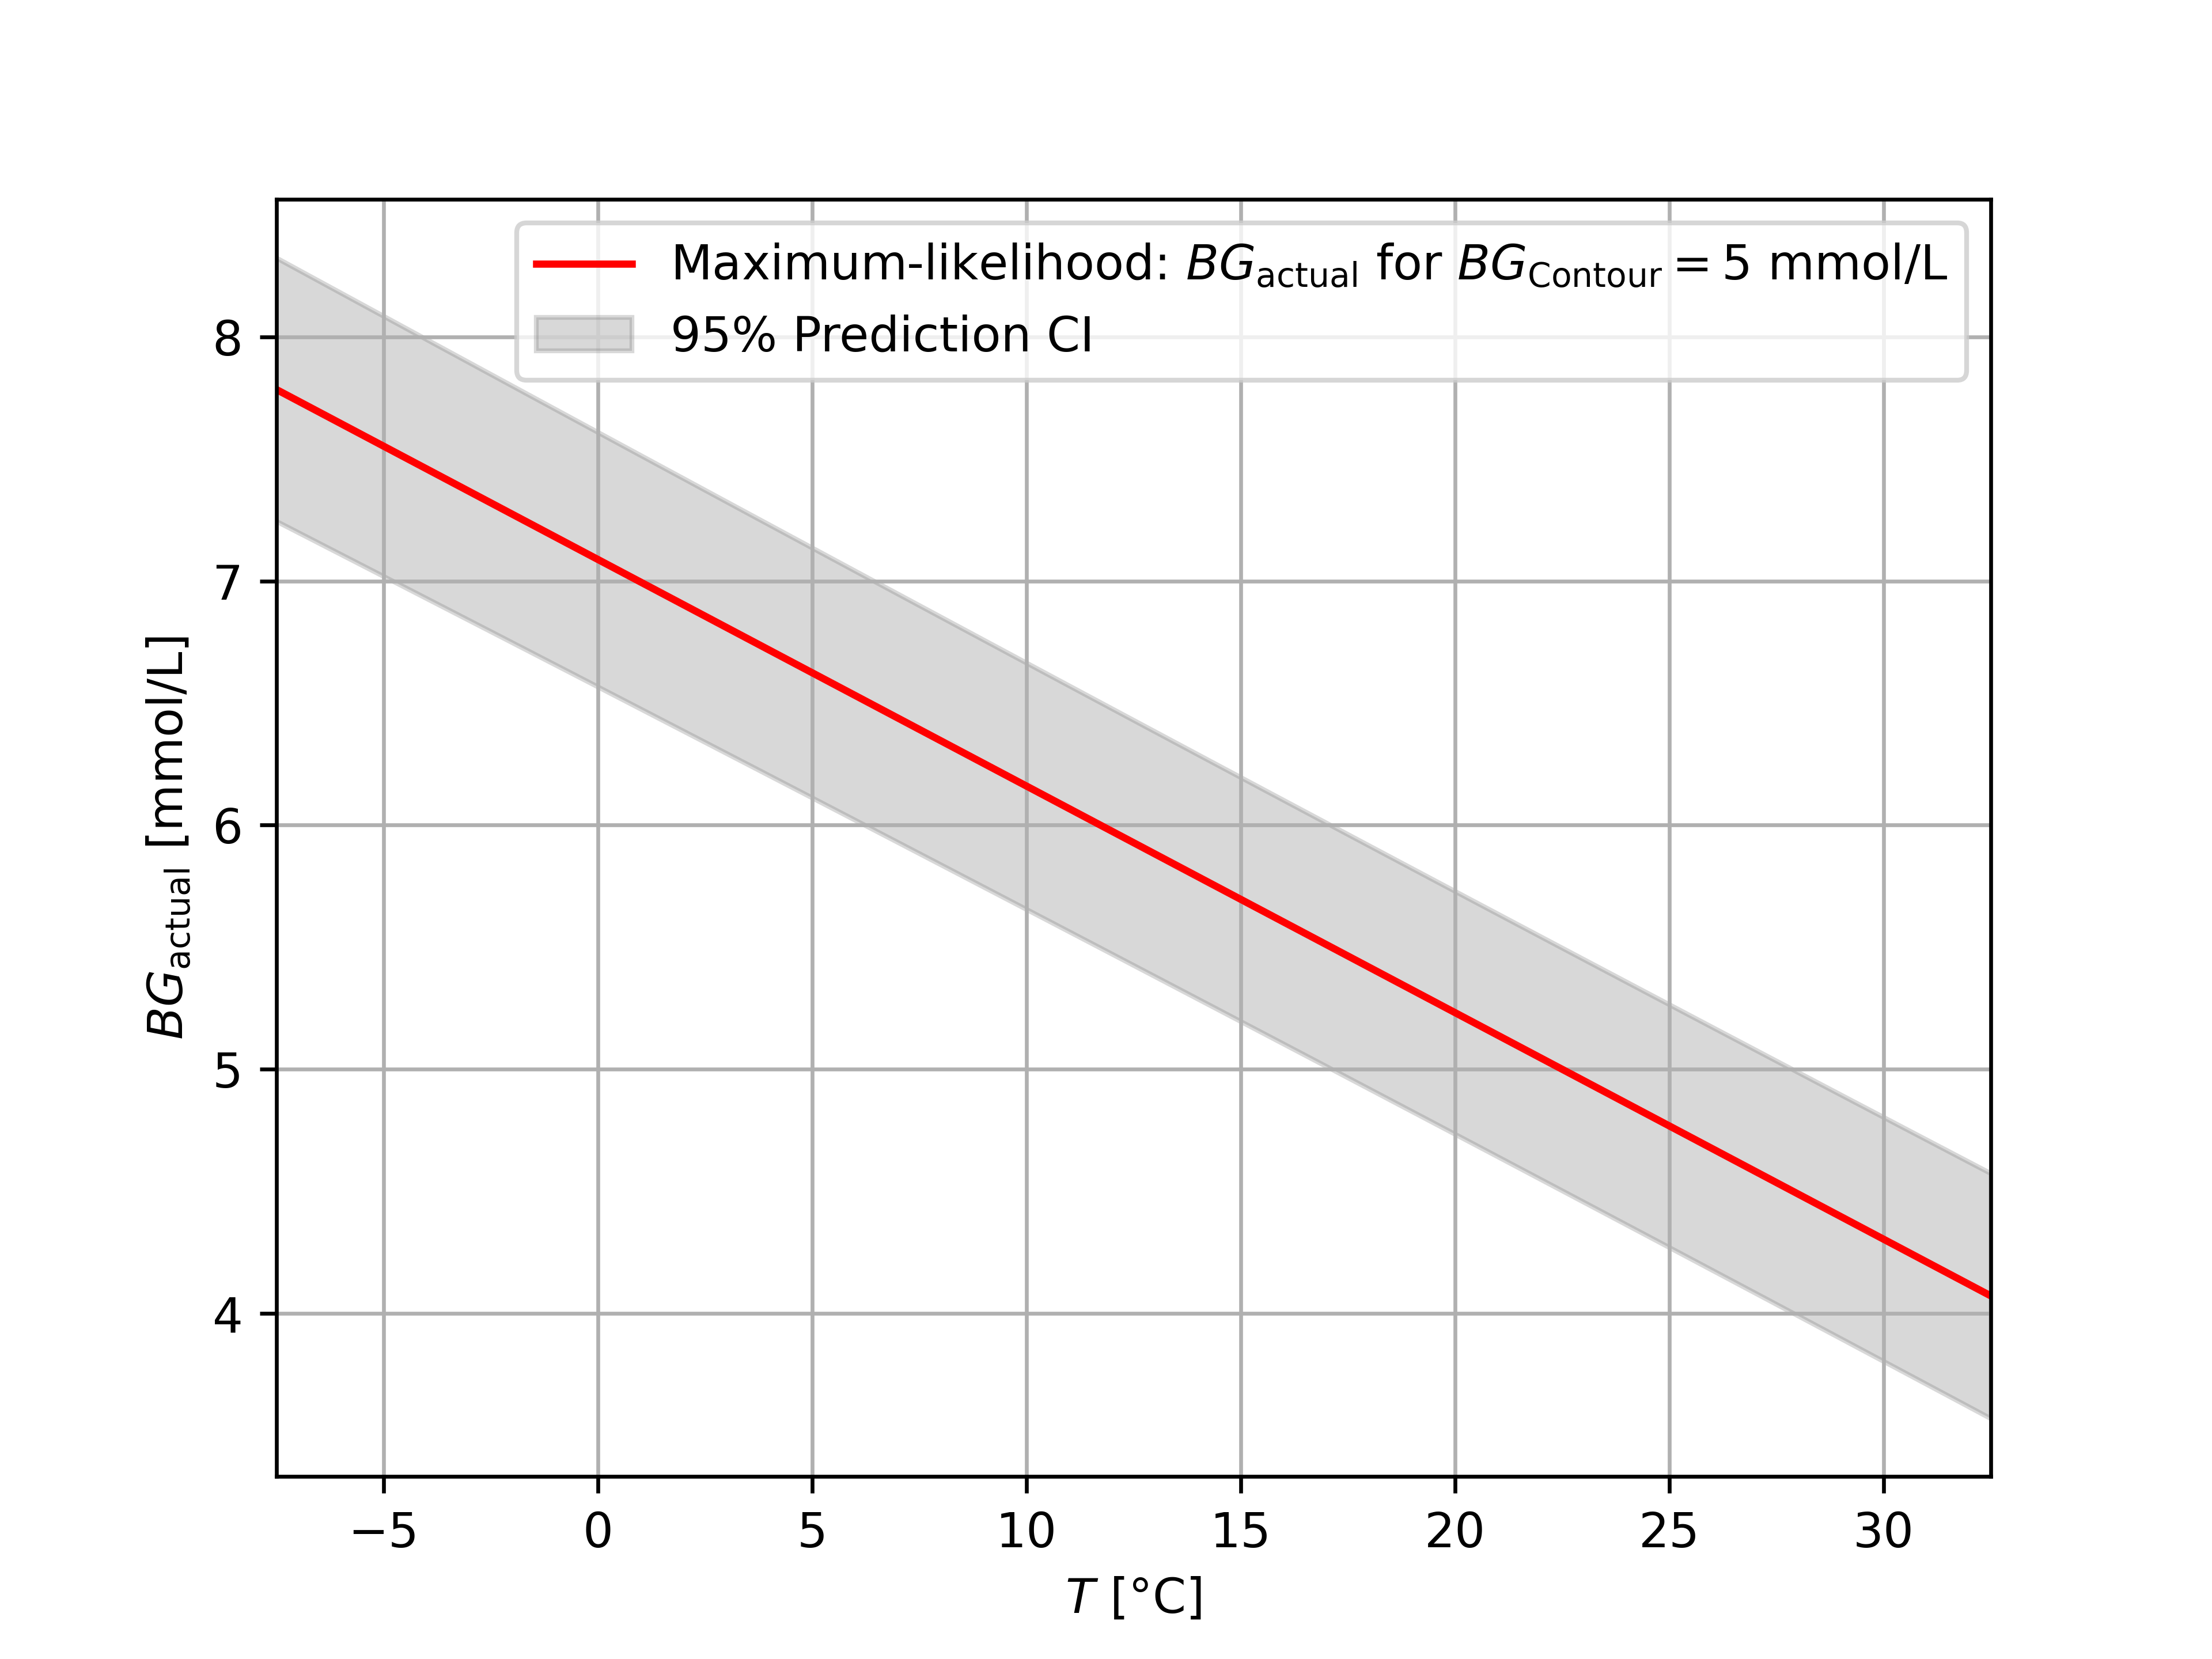
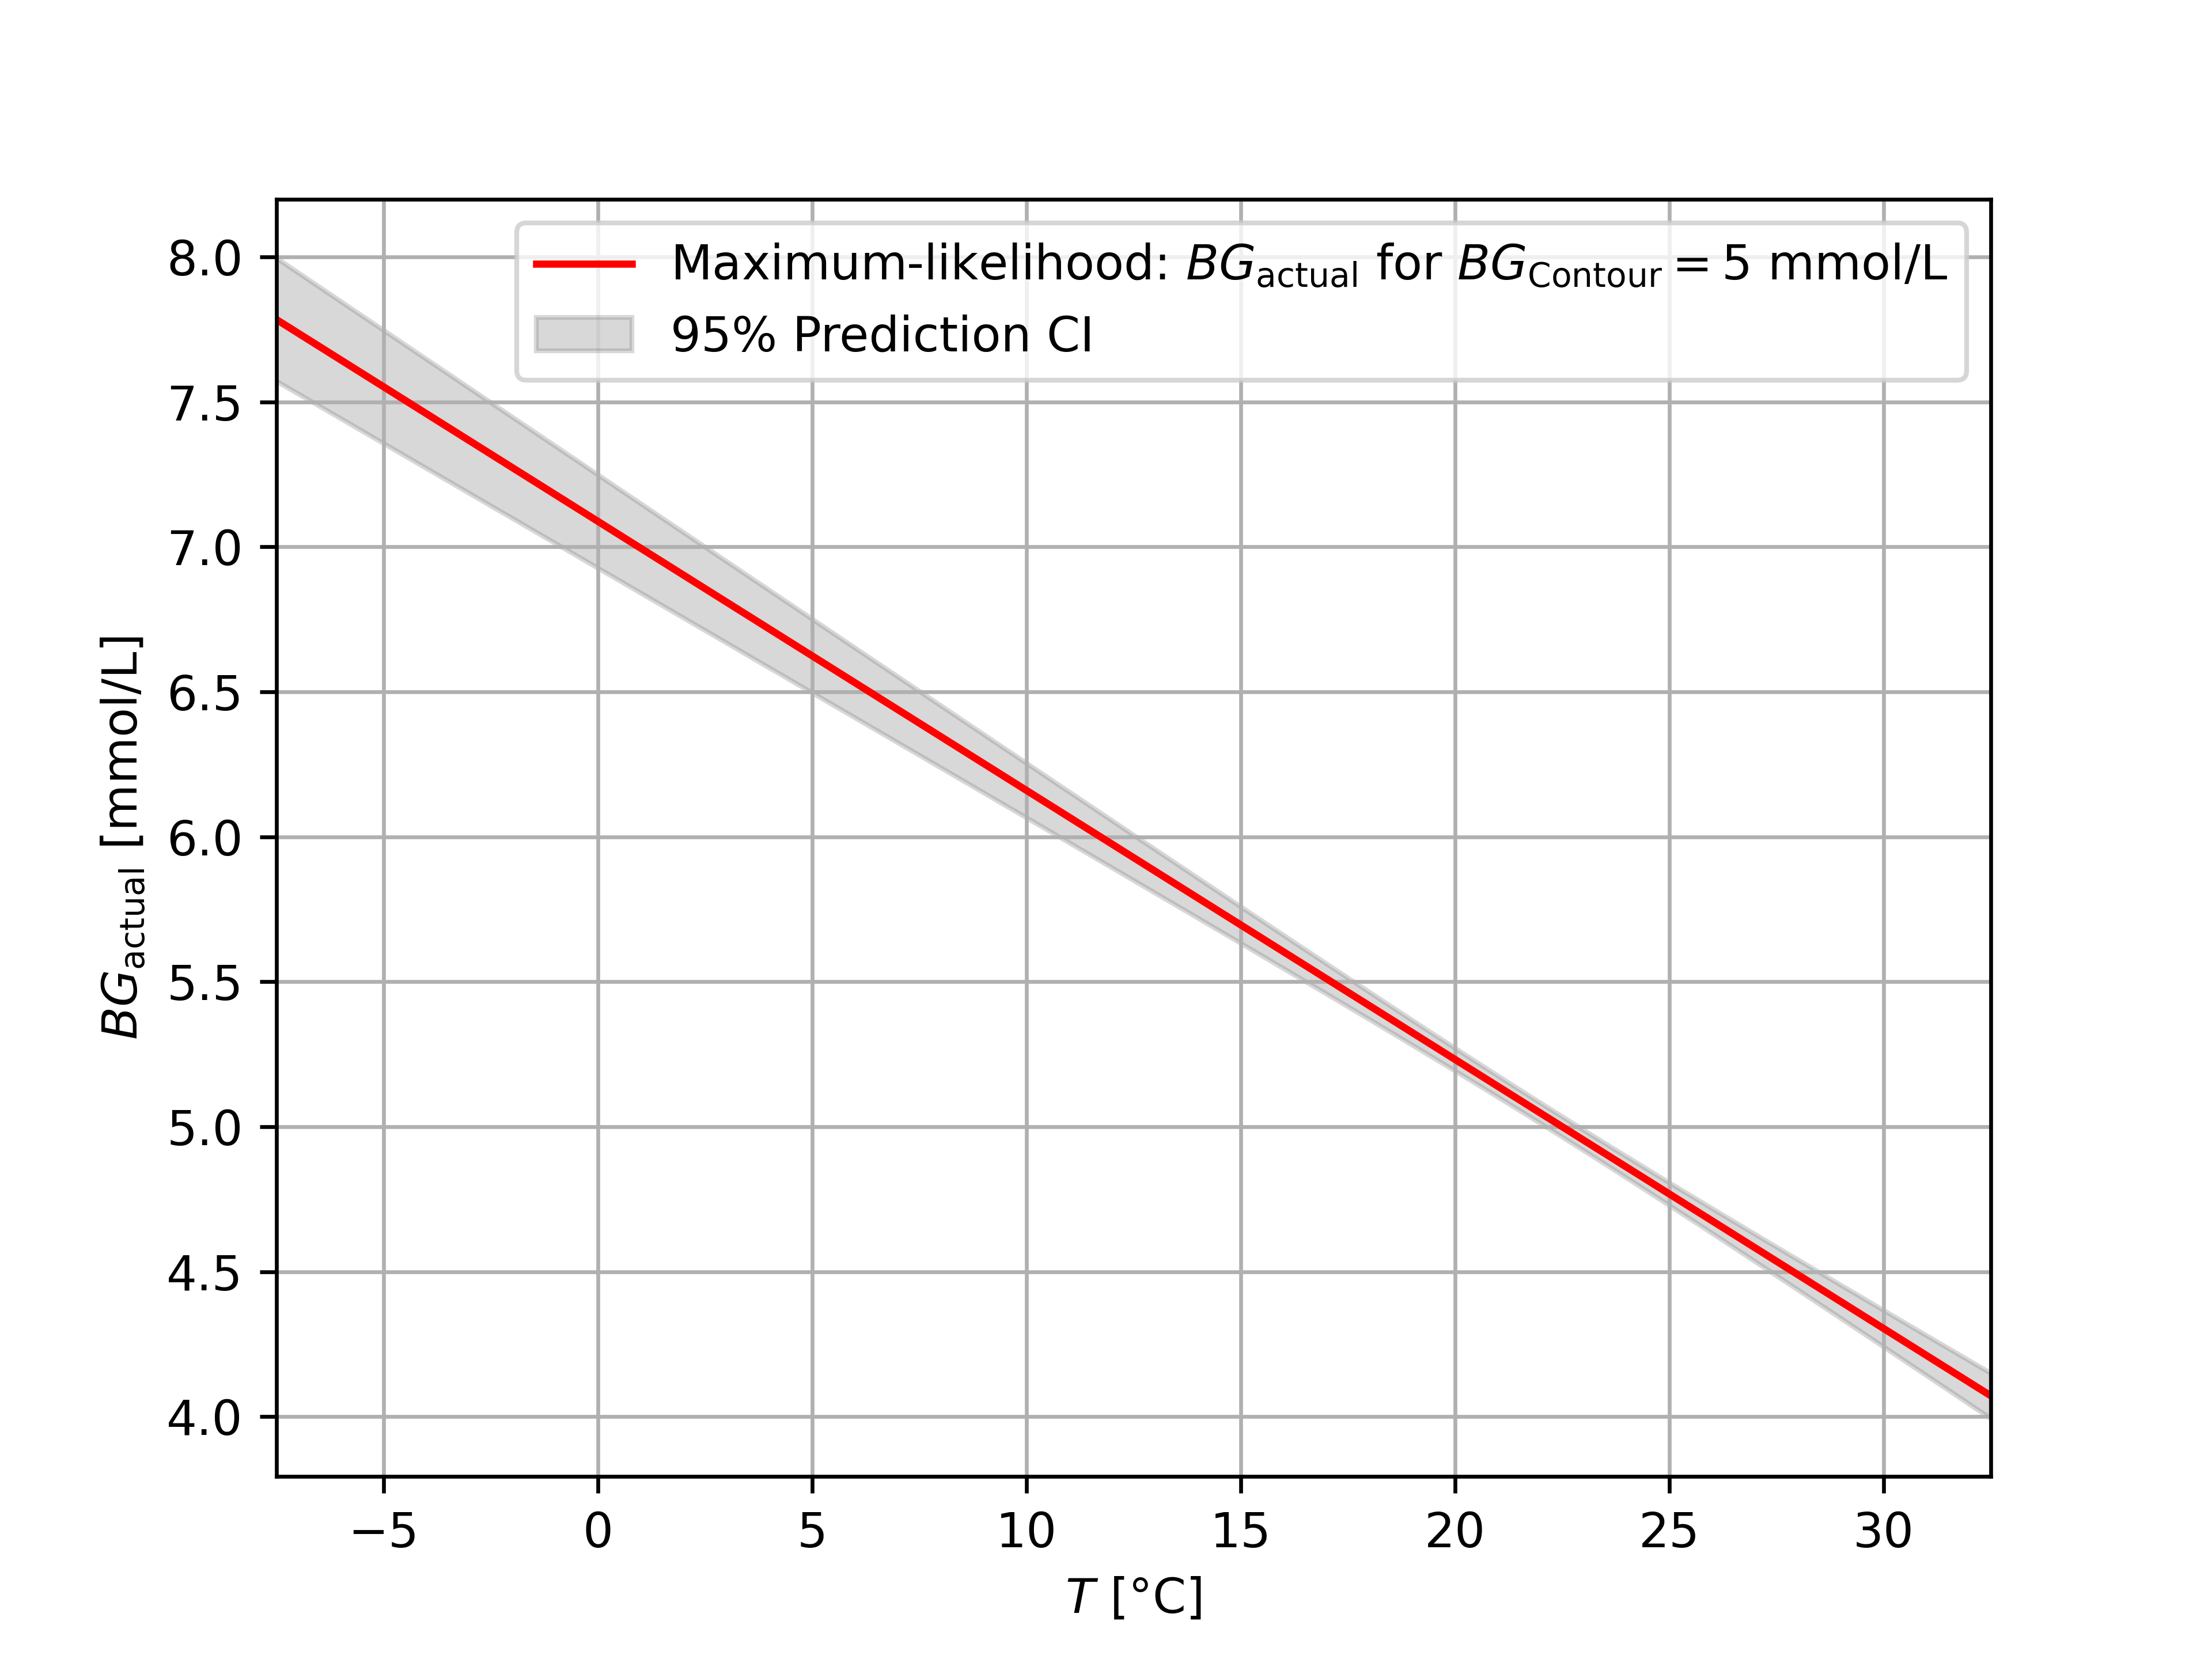
There are several reasons why it is not unexpected that the data points have such a large variance. One reason is that we are looking at the difference of two blood sugar measurements. This makes the variance two times as large! This is not an issue for making predictions, though. In real life, we never look at the difference between two measurements. Instead, we generally take a single measurement and base our blood glucose management on that single measurement. Suppose we are out and we do a measurement using our Contour Next One and it reports a blood glucose of 5 mmol/L. Based on the above experiments, we obtain the following figure.
![]()
![]()
We should take this graph with a grain of salt, because most data was collected between 0 and 15 °C, but it is still striking to me! I am often in countries where temperatures are higher. If the temperature is around 40 °C and my Contour Next One reports 5 mmol/L, I might actually be facing hypoglycemia already!
If you think the confidence interval is too wide, you can decide to do multiple blood tests in a row and average their value. To give you an idea of what the confidence intervals look like for 2, 4, and 200 samples, we have the following figures.
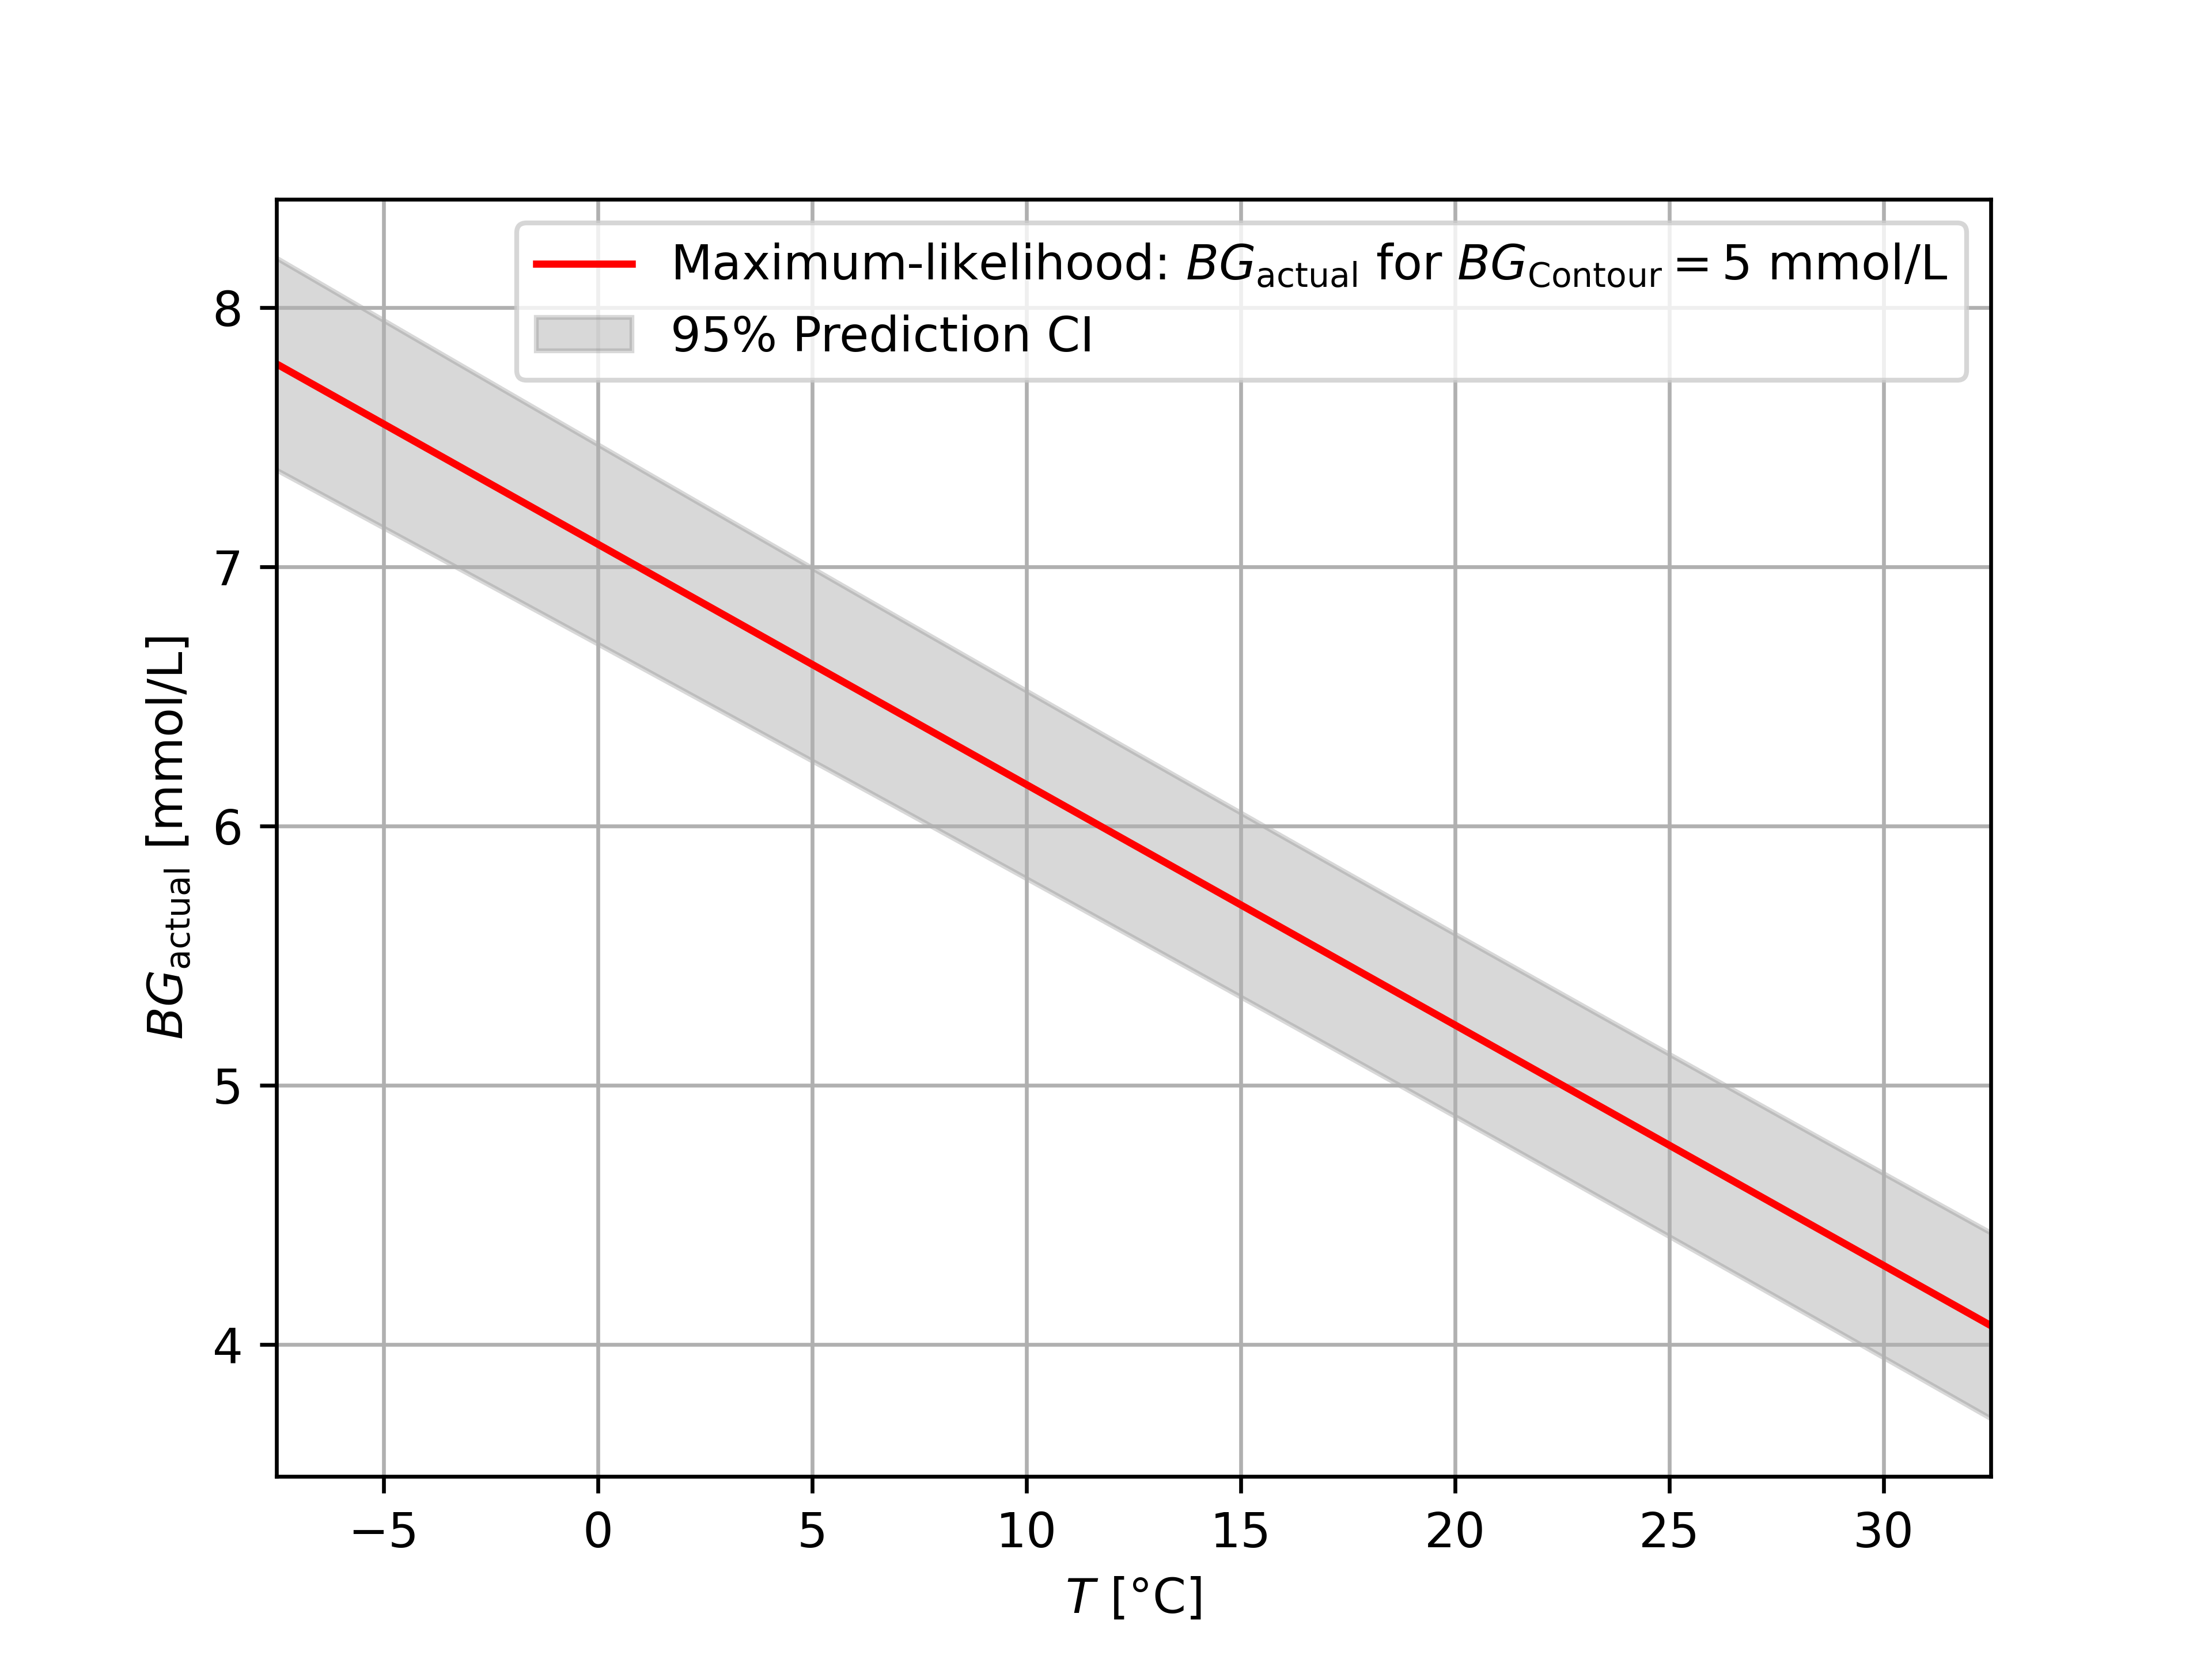
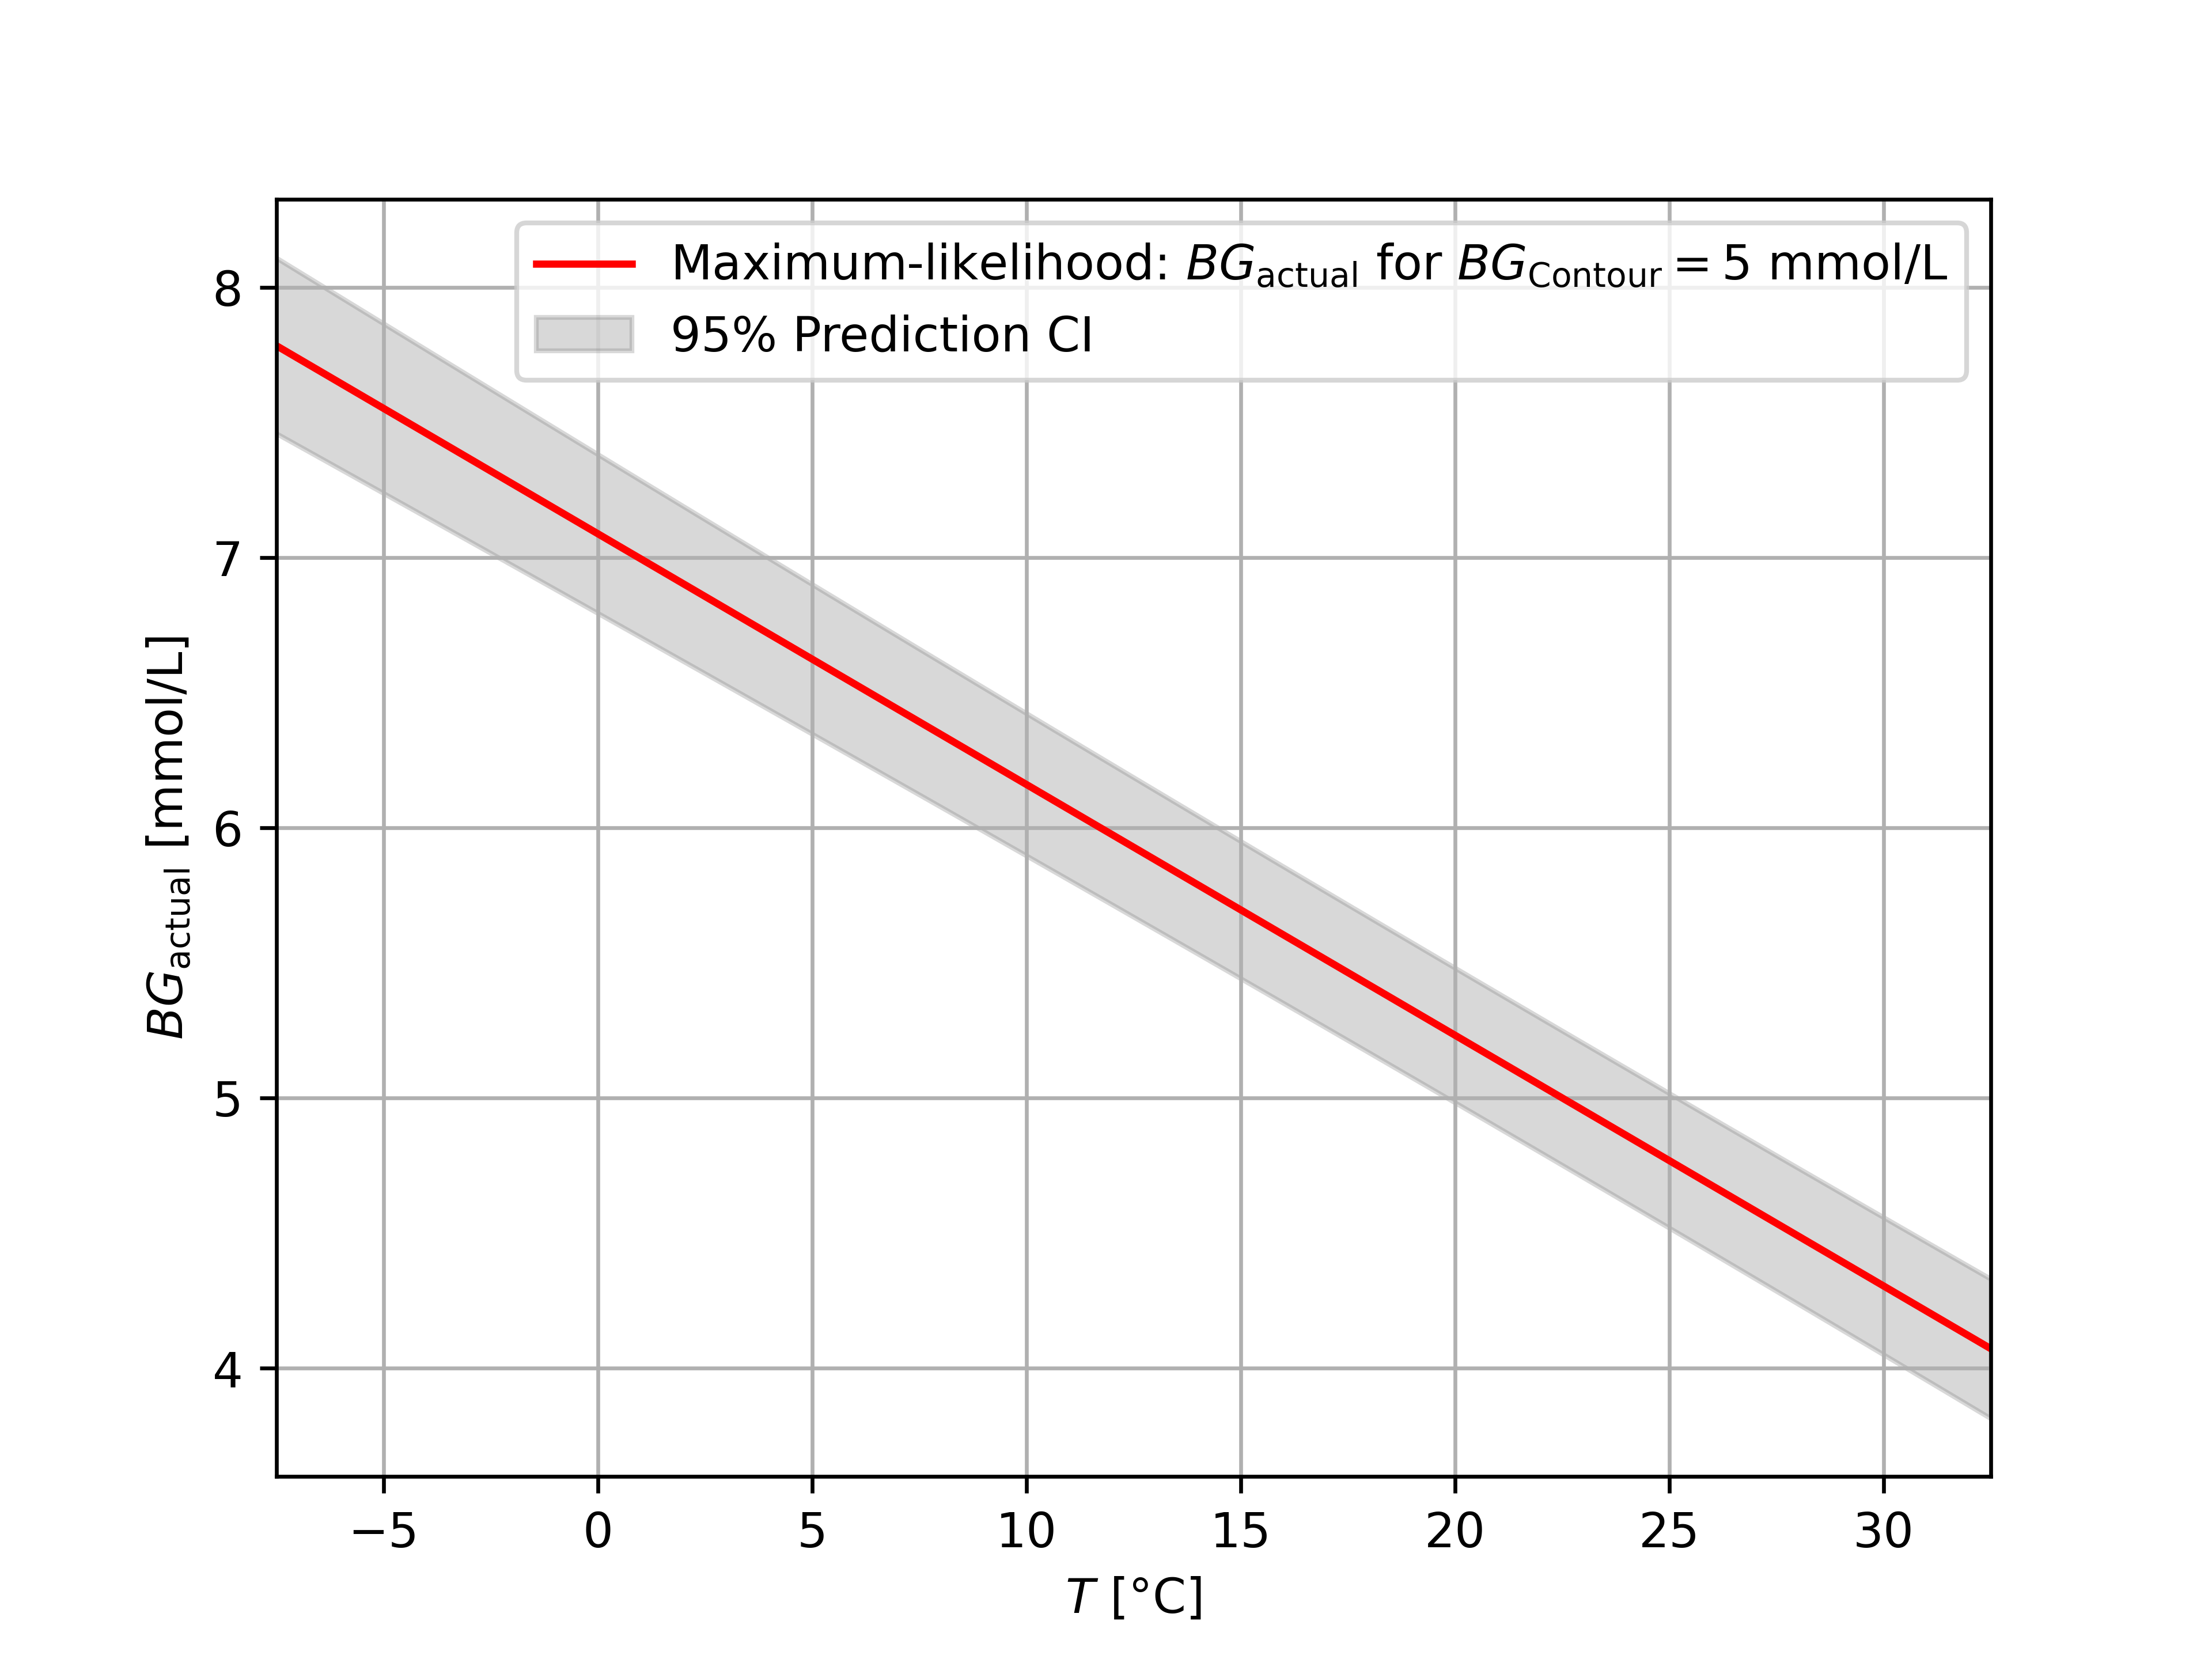
If you take a LOT of samples, the confidence interval reduces to the confidence interval of $\beta$, because the effect of the random variable $\epsilon_1$ is averaged out. However many samples we take, we will not be able to make the confidence interval any tighter.
How does this help us in real life?
The main thing you should take away from this article is that temperature matters! From the data it is obvious that readings become completely unreliable at extreme temperatures. I take this into account when I go out in winter. Whenever I go out, I carry a thermometer with me. This thermometer is attached to my jacket or my backpack. It needs to be directly exposed to the outside and cannot be kept in a pocket or backpack. The reason for this is that many thermometers require at least a couple minutes to adjust to the outside temperature. This means that if you keep the thermometer in your pocket and take it out to check the temperature, it might indicate unrealistically high temperatures. Whenever I would like to check my blood sugar, I take my Contour Next One and perform a blood sugar measurement and note down the reported blood sugar. Then I compute my actual blood sugar using
$$\text{Blood Sugar [mmol/L]} = \text{Reported Blood Sugar [mmol/L]} + 0.0928 (\text{Temperature [$^\circ C$]} - 22.5^\circ C).$$Since I often do these computations in my head, I might approximate 0.0928 by 0.1. Equivalently, in US units, we have
$$\text{Blood Sugar [mg/dL]} = \text{Reported Blood Sugar [mg/dL]} + 0.928 (\text{Temperature [$^\circ F$]} - 72.5^\circ F).$$I also always keep in mind the 95% confidence interval, so I will often subtract 0.5 mmol/L to be around 95% sure that my actual blood sugar is above the computed value. I used 22.5°C as the temperature for which the Contour Next One gives the most accurate readings, but this is just an educated guess. I took this value, because it represents room temperature. However, we would need a reference device to figure out to which temperature the Contour Next One is calibrated. We should also not forget that different batches of test strips might be calibrated differently and the wear of the device itself might change its behaviour in the future. All in all, I would say that we should advocate for more transparancy from companies that produce medical devices. Such limitations as temperature dependence should be communicated clearly to doctors and patients!
https://www.accessdata.fda.gov/cdrh_docs/reviews/K160682.pdf ↩︎
S. Tsujimura et al, “Novel FAD-Dependent Glucose Dehydrogenase for a Dioxygen-Insensitive Glucose Biosensor” (https://www.jstage.jst.go.jp/article/bbb/70/3/70_3_654/_pdf) ↩︎
https://github.com/woutertonnon/ContourNextTemperature.git ↩︎